GraphIt plus+
Need more graphing capabilities? GraphIt plus+ gives you additional features to dig deeper into your building’s performance.
Be able to:
- quickly identify under-performing buildings
- set investment priorities
- verify energy efficiency improvements
- see immediately how energy retrofits are impacting your buildings’ sustainability objectives.
GraphIt Plus gives you:
- Ranking reports
- Temperature
- Power Factor
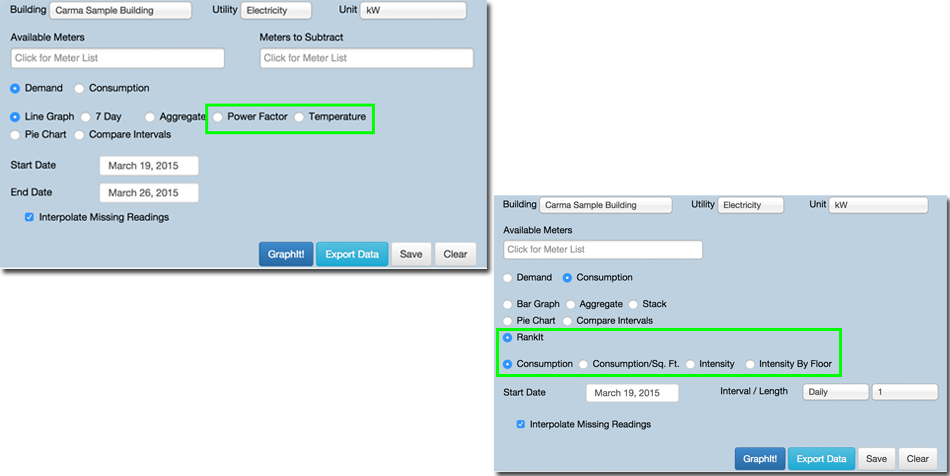
Ranking Reports
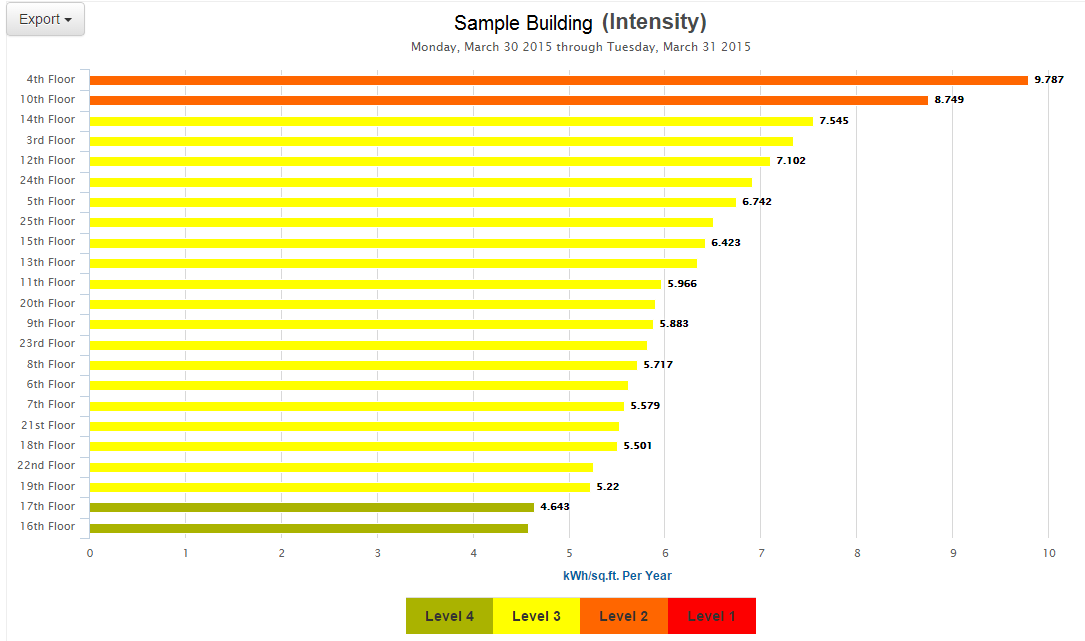
Benchmark Your Building’s Energy Performance!
Gives you the ability to produce a color-coded environmental ranking report that displays BOMA BEST sustainability certification levels.
Intensity by Building
- Level 1 (Red) - greater than 35.3
- Level 2 (Orange) – greater than 28.9, less than 35.3
- Level 3 (Yellow) – greater than 19.6, less than 28.9
- Level 4 (Green) – less than 19.6
Intensity by Floor
- Level 1 (Red) - > 10
- Level 2 (Orange) – greater then 8 less than 10
- Level 3 (Yellow) – greater than 5 less than 8
- Level 4 (Green) – less than 5
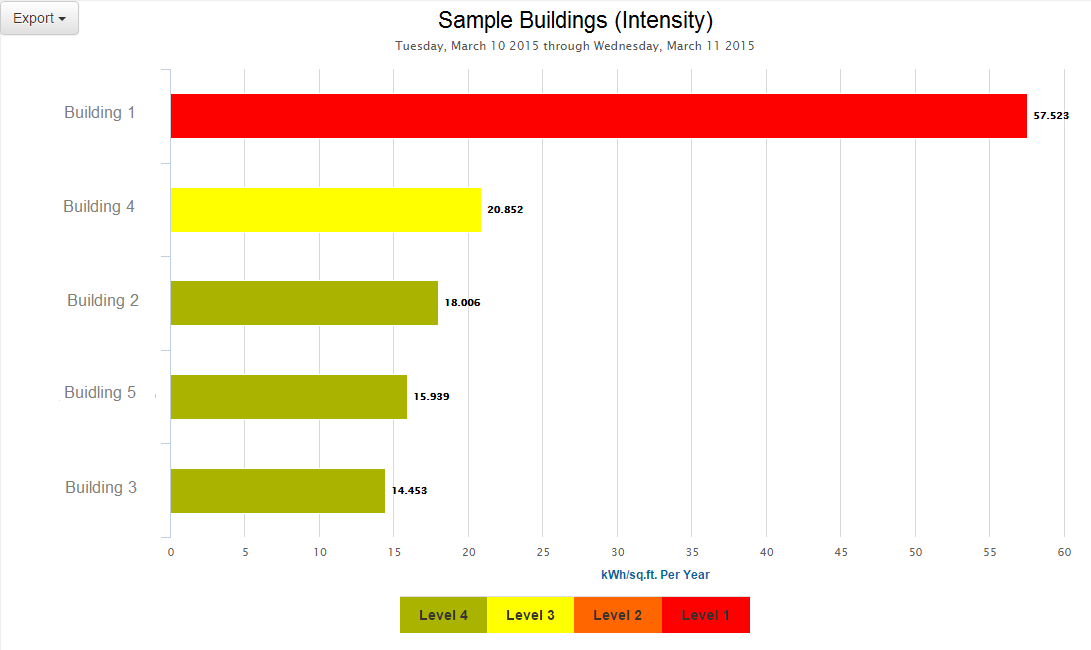
Have the ability to see contrasting views of buildings, and organize buildings for easy comparisons and see energy usage expressed in understandable units, all on the same screen.
View energy use by electricity, water and gas rankings, all displayed in an attractive graph format. It's an energy report card for your buildings.
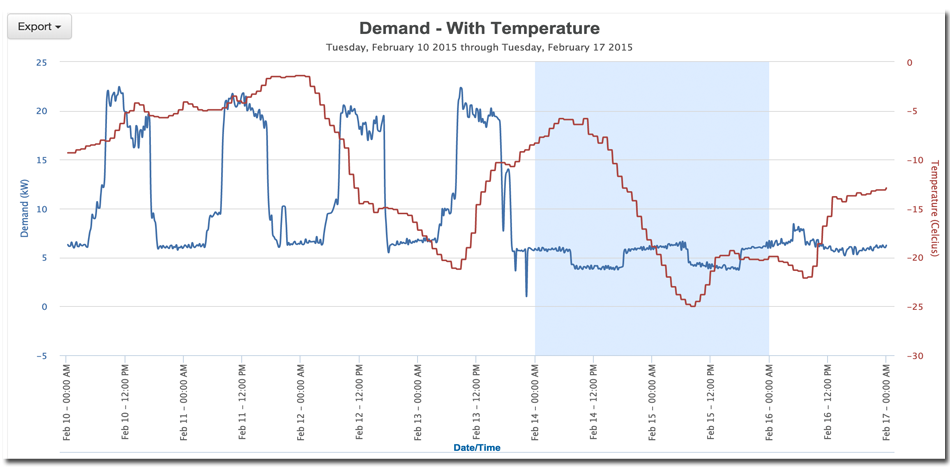
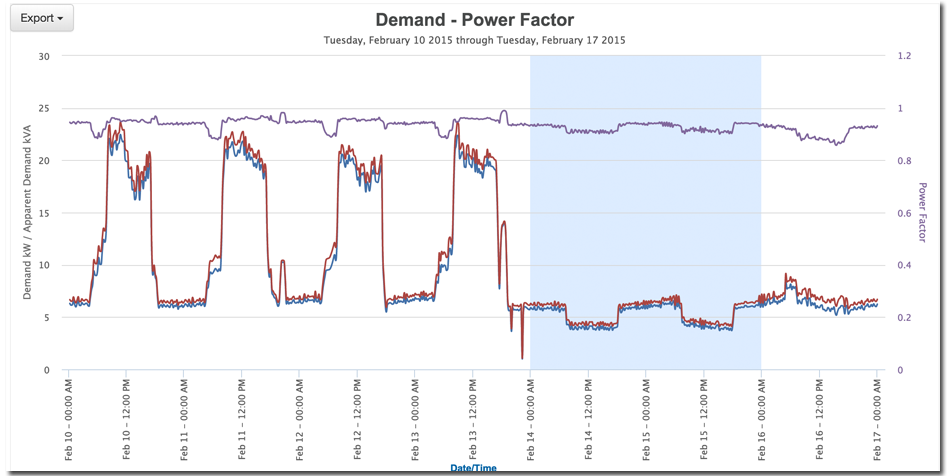
Temperature
See the correlation between your power usage and the outside temperature.
Power Factor
Power factor tells you how efficiently you are using your power.
| Feature | GraphIt! | GraphIt! Plus |
|---|---|---|
| Graph Demand and Consumption | ||
| Demand Line and Consumption Bar (Multi Meter support) | ||
| Pie Graphing | ||
| Aggregate | ||
| Stack | ||
| 7 Day Overlay | ||
| Compare Intervals | ||
| RankIt! Ranking | ||
| Temperature | ||
| Power Factor |