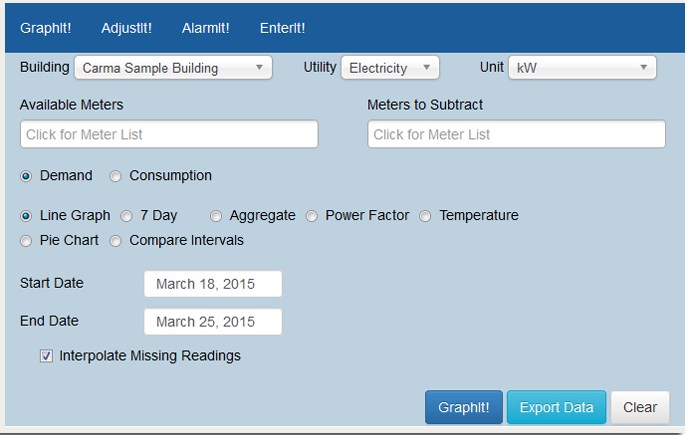
GraphIt!
The energy profiling portion of CARMAplus+, GraphIt! gives you the ability to create building profiles to help you understand your property's energy performance.
Graphing profiles can be generated for:
- Consumption
- Demand
Graphing
CARMAplus+ has the capability to graph both demand and consumption utility usage. Information can be displayed in a variety of formats to help you analyze your building's energy use patterns.
Graphic profile information can be printed, saved as a PDF file, saved as an image (JPEG or PNG), and export the raw data to a CSV file.
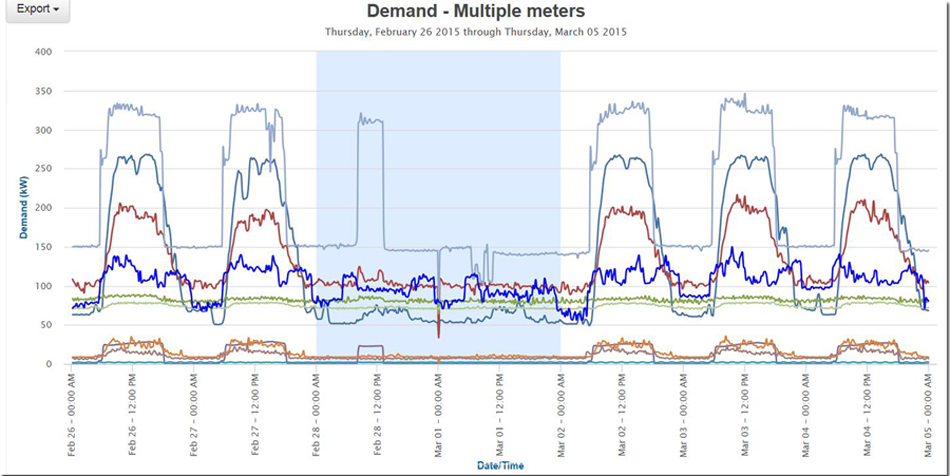
One Week Demand Profile - Multiple Meters
A snapshot of a building in time. Regular demand profiles are an important too for buildings with lots of meters.
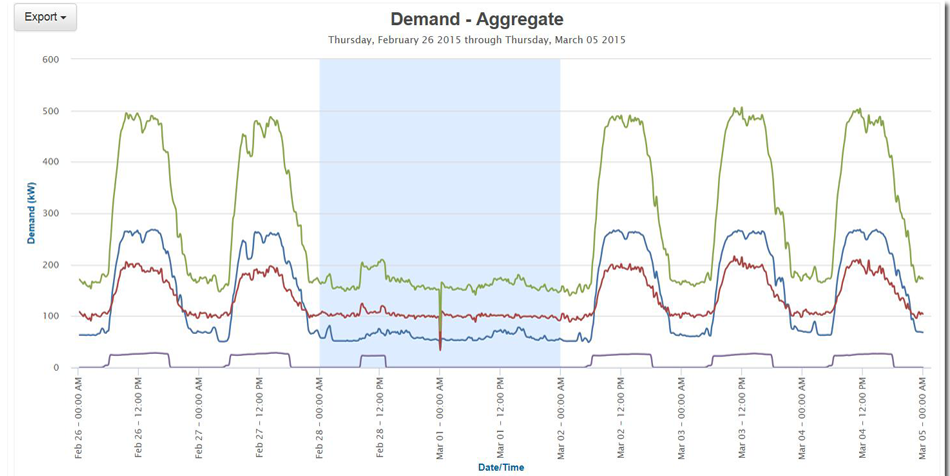
Aggregate
Demand Graph Total of all the meters.
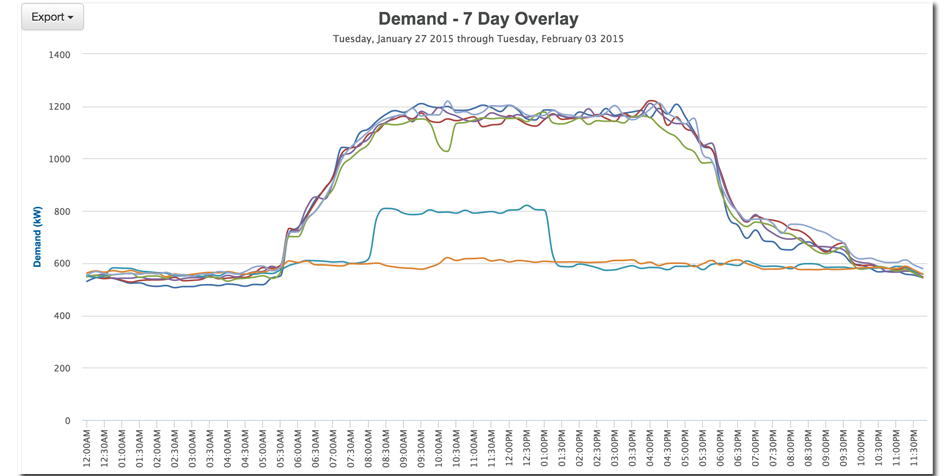
7 Day Overlay
Demand Profile - 7 Day Overlay
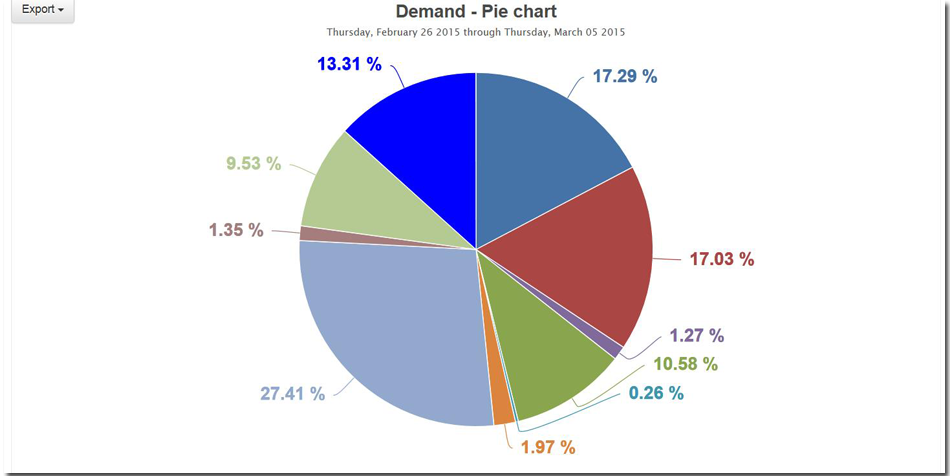
Demand Pie Chart
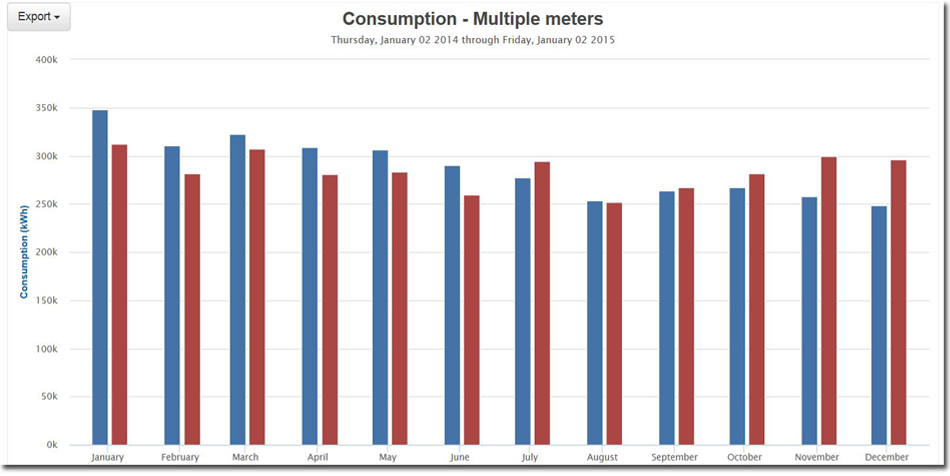
Consumption - Multiple Meters
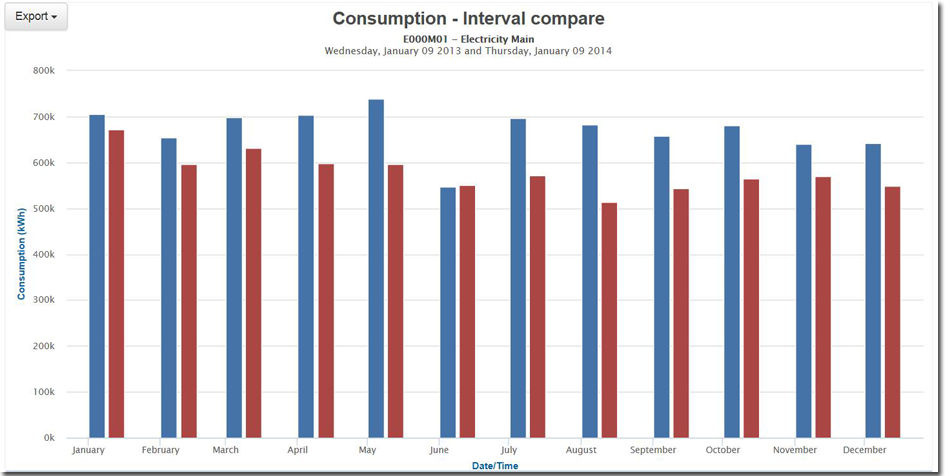
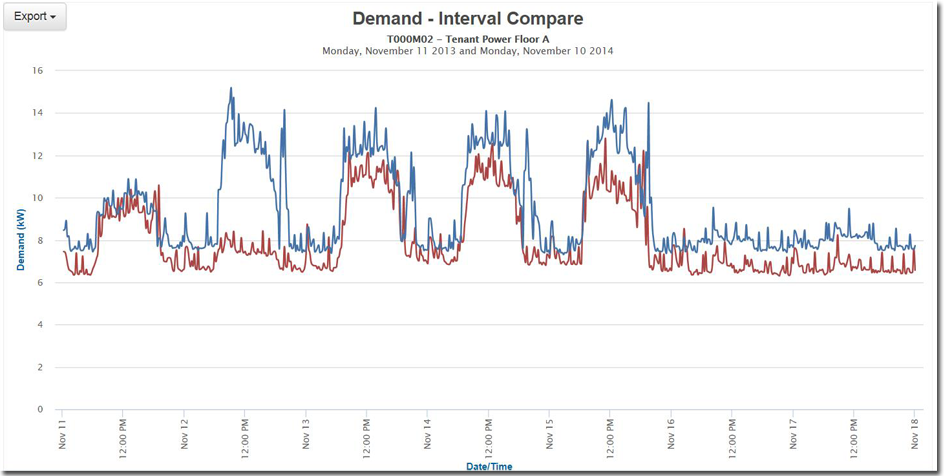
Interval Comparison - Demand
Interval Comparison - Consumption